


Understanding the VEQTOR Index - Volatility strategies
4 mensagens
|Página 1 de 1


Understanding the VEQTOR Index - Volatility strategies
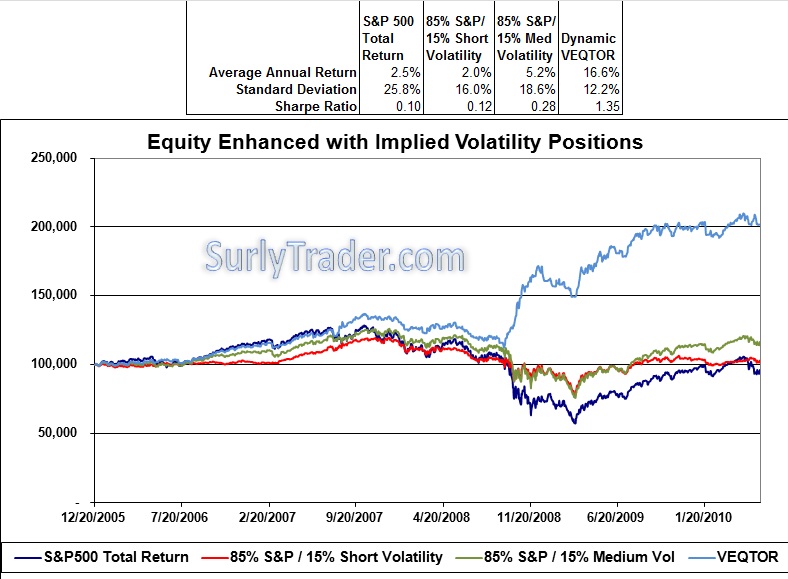
It is unfortunate that there are not more mutual funds or ETF’s that directly enhance long equity positions with option overlays. I have covered the enhanced Sharpe ratios (risk-adjusted returns) that often accompany these strategies. I was surprised to find out that Direxion is going to bring the S&P 500 Dynamic VEQTOR Index to the mainstream retail investor packaged nicely in a simple ETF. As a follow-up to my readers’ requests when I first described the strategy’s performance, I want to take a closer look at just how the index makes systematic calls on implied volatility and how it has achieved such stellar returns.
The S&P 500 Dynamic VEQTOR Index (Volatility EQuity Target Return) represents an investment in the broad equity market with a dynamically rebalanced volatility allocation. The strategy gains its volatility overlay through the use of short-term VIX futures. The premise of the strategy is that the VIX has a correlation with the S&P 500 of about -73%. When the S&P 500 falls sharply, the VIX spikes and then slowly reverts to a long-term mean. Under the simplest strategy, a fixed allocation to VIX futures will reduce the volatility of the long equity portfolio by providing a positive offset when the equity market corrects. This would increase the risk-adjusted returns of the portfolio by reducing the tails of the portfolio’s return distribution. If the idea is taken one step further, then we can introduce a tactical allocation in volatility wherein the investor can capture the gains from a volatility spike by reducing the allocation to volatility under the assumption that it will eventually revert to the mean.
The S&P 500 VEQTOR Index has the following characteristics:
Daily rebalancing mechanism
Dynamic long exposure to equities and implied volatility which are based on the realized volatility trend and environment
Stop-loss
In order to determine the implied volatility trend, the index uses the following scheme which requires 10 consecutive daily indicators:
Uptrend: 5-day Average Implied Volatility > 20-day Average Implied Volatility
Downtrend: 5-day Average Implied Volatility < 20-day Average Implied Volatility
No Trend: Neither
With our trends established, we can look at the respective allocations:
Dynamic VEQTOR Strategy Allocation AlgorithmRealized Volatility Environment* Implied Volatility Downtrend No Implied Volatility Trend Implied Volatility Uptrend
Less than 10% 97.5%/2.5% 97.5%/2.5% 90%/10%
10% to 20% 97.5%/2.5% 90%/10% 85%/15%
20% to 35% 90%/10% 85%/15% 75%/25%
35% to 45% 85%/15% 75%/25% 60%/40%
Greater than 45% 75%/25% 60%/40% 60%/40%
*The realized volatility environment is determined using the last 22 trading days.
The last piece of the puzzle is the stop-loss feature. Every day, the 5-business day performance of the excess return strategy is evaluated. If there is a loss greater or equal to 2%, both equity and volatility allocations are moved to 100% cash position at the close of the following business day. The strategy will allocate back into equity and volatility once the 5-business day loss is less than 2%.
After a long-winded explanation – just how did it do?
Not a bad strategy at all...
I challenge you all to use this as a guideline for starting your own long vol / long equity strategy. I think there is a lot of promise in these types of strategies as tools for individuals and fund managers.
- Mensagens: 1750
- Registado: 18/12/2009 18:54
- Localização: 16
4 mensagens
|Página 1 de 1
Quem está ligado:
Utilizadores a ver este Fórum: Nenhum utilizador registado e 142 visitantes