


VIX
Elias Escreveu:zecatreca Escreveu:Aponta outra:
-sempre que tivermos subidas ou descidas diárias de 15-17% no vix o dia seguinte no sp500 tende a ser vermelho ou verde, respetivamente.
É mais ao contrário, não?
Sim é ao contrário.
Já estava a entrar na hora do descanso...
O Sô Tôr Rsacramento e o Sô Tôr SergioS12 esqueceram-se da vela de ontem.... andam a come-las?
No sp500 basicamente tudo aponta para subidas até aos 1570´s novamente e quando voltar aos 1540, é para partir.
Engraçado:
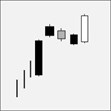
Acho que ficava bem no gráfico diario do SP500, mais uma vela verde e outra vermelha na sexta feira anulando o D.L. . Fazia sandwish no diário conjuntamente com um padrão interessante de inversão (se fechar a semana a 1540-50) no semanal.
Daí um HS com neck nos 1540, uma sandwish no diário e no semanal um bearish engulfing...
Não sei se me fiz entender
Ando cá com uma imaginação....que dizes?
- Anexos
-
- vix 18-4-2013.png (63.55 KiB) Visualizado 18645 vezes
-

- Mensagens: 5593
- Registado: 29/11/2007 10:54
- Localização: Aveiro
Elias Escreveu:zecatreca Escreveu:Aponta outra:
-sempre que tivermos subidas ou descidas diárias de 15-17% no vix o dia seguinte no sp500 tende a ser vermelho ou verde, respetivamente.
É mais ao contrário, não?
Pois
Escrever é bem mais difícil do que parece.
Vamos ver se posso ajudar (e se bem compreendi) o raciocínio.
O VIX tem um movimento inverso ao SP500.
Sempre que o VIX sobe ~15%, no dia seguinte (em princípio) ele desce, logo o SP500 sobe.
- Anexos
-
- 2013_04_16_SP500_Versus_VIX.jpg (50.12 KiB) Visualizado 18793 vezes
-
- Mensagens: 448
- Registado: 10/8/2011 1:14
- Localização: 16

Elias Escreveu:zecatreca Escreveu:«
1º dia fecha fora
2º dia fecha dentro
3º dia terá de fechar pelo menos abaixo do fecho do 2ºdia.
Então o 3º dia se fecha abaixo do 2º dia também fecha dentro certo?
abaixo do fecho do 2º dia. Sim. Ja agora le o post anterior pq o editei...
-
- Mensagens: 5593
- Registado: 29/11/2007 10:54
- Localização: Aveiro
Elias Escreveu:Excelente rscramento, obrigadão!
Prof. zeca: para haver D. Lei tem de fechar 2 dias seguidos fora das BB ou basta um dia como aconteceu na segunda?
1º dia fecha fora
2º dia fecha dentro
3º dia terá de fechar pelo menos abaixo do fecho do 2ºdia.
Eu quebro muitas vezes o D.L. porque não obedeço ao 3dia, antecipando-me muitas vezes no 1º.
Já agora a divergência que existe entre sp e vix foi confirmada. Se virmos 100pontos de quedas no sp, a contar dos maximos (1597) será perfeitamente normal.
Amanha actualizo.
Está na hora do descanso.
Aponta outra:
-sempre que tivermos subidas ou descidas diárias de 15-17% no vix o dia seguinte no sp500 tende a ser vermelho ou verde, respetivamente.
Exemplo de hoje: vix subiu 18%...amanha o sp fecha verde.
rsacramento Escreveu:zoom
Sô tôr...
ohhh....
sô tôr...
Então?
Cumé?
A vela de hoje?
comeu-a?
-
- Mensagens: 5593
- Registado: 29/11/2007 10:54
- Localização: Aveiro
-

- Mensagens: 10503
- Registado: 29/11/2007 12:50
-
- Mensagens: 10503
- Registado: 29/11/2007 12:50
zecatreca Escreveu:Elias...entao o gráfico do rsacramento é feio?não gostas dele?
Epa... custa-me responder sem estar aqui o rsacramento para se defender... mas a resposta é "não" - e não gosto porque as velas são tão estreitas que não se percebe bem as que são brancas e as que são "recheadas"
- Mensagens: 35428
- Registado: 5/11/2002 12:21
- Localização: Barlavento
Elias Escreveu:zecatreca Escreveu:outra vez?Elias Escreveu:Professor Zeca... não se orienta um graf?
ontem meti um...
meteste? onde?
confesso que me passou (talvez porque estava à espera que o metesses neste tópico)zecatreca Escreveu:Mas se insistires muito e responderes à minha pergunta no topico do DAX...pode ser que ainda meta qualquer coisa.
vou ver a questão que também me escapoursacramento Escreveu:serve?
serve claro, mas também tenho interesse no do professor por causa das BB
Meti no topico do sp dia 16...de manhazinha penso eu de que...
Assim que tiver oportunidade meto outra vez aqui.
O Vix subiu mais de 17% e fechou fora das BB. Amanha devemos ter dia verdinho no sp500.
Elias...entao o gráfico do rsacramento é feio?não gostas dele? eu gosto de um grafico com 2 ou três rabiscos pelo menos. Meter um gráfico "limpo" mais vale ir aos stockchart e ver lá o dito cujo...
-
- Mensagens: 5593
- Registado: 29/11/2007 10:54
- Localização: Aveiro
zecatreca Escreveu:outra vez?Elias Escreveu:Professor Zeca... não se orienta um graf?
ontem meti um...
meteste? onde?
confesso que me passou (talvez porque estava à espera que o metesses neste tópico)
zecatreca Escreveu:Mas se insistires muito e responderes à minha pergunta no topico do DAX...pode ser que ainda meta qualquer coisa.
vou ver a questão que também me escapou
rsacramento Escreveu:serve?
serve claro, mas também tenho interesse no do professor por causa das BB
- Mensagens: 35428
- Registado: 5/11/2002 12:21
- Localização: Barlavento
-
- Mensagens: 10503
- Registado: 29/11/2007 12:50
Elias Escreveu:The S&P 500 could well test the 1,350 area - a 12 percent drop from current levels - or even see the 1,267 area, which would constitute an 18 percent tumble, she said.
Xiiiiiiii.... cum catano!
18% também não acredito!
10%....para mim, seria normal (e ja o disse varias vezes por causa das divergências nos.. blá blá blá blá...).
12%, ok, tranquilo.
18%!!!! Pára aí. Tudo pra este ano? Será que ela bebeu alcool antes da entrevista?
-
- Mensagens: 5593
- Registado: 29/11/2007 10:54
- Localização: Aveiro
The VIX Is Getting Ready to Take Market on a Ride
Published: Wednesday, 17 Apr 2013 | 1:31 PM ET
By: Jeff Cox
CNBC.com Senior Writer
Volatility's prolonged absence from the stock market appears to be coming to an abrupt end.
After being largely invisible for the past nine months - coinciding with a sharp equity rally - several signs indicate that instability is coming back.
Call options buying recently hit a three-year high for the CBOE's Volatility Index, a popular measure of market fear that usually moves in the opposite direction of the Standard & Poor's 500 stock index.
(Read More: Scary Pattern Could Be Forming on S&P 500 Chart)
A call buy, which gives the owner the option to purchase the security at a certain price, implies a belief that the VIX is likely to go higher, which usually is an ominous sign for stocks.
"We saw a huge spike in call buying on the VIX, the most in a while," said Ryan Detrick, senior analyst at Schaeffer's Investment Research. "That's not what you want to hear (because it usually happens) right before a big pullback."
The last time call options activity hit this level, on Jan. 13, 2010, it preceded a 9 percent stock market drop that happened over just four weeks, triggered in large part by worries over the ongoing European debt crisis.
"That obviously has been the smart money in the past," Detrick said. "We're not ignorant to the fact that this could be the same thing. The fears out of Europe for whatever reason spring up in the springtime."
(Read More: IMF Deals Blow to UK's Growth Optimism)
Technical strategists also have been watching the VIX's chart behavior. The optimistic case, Detrick said, is that Monday's major spike represented a one-off event that would not be repeated.
But Abigail Doolittle, technical strategist at the Seaport Group, said she sees a potential "ugly bottoming pattern" that could portend a messy time for the stock market.
Doolittle said she sees something "2011-ish" during which the VIX swelled beginning in June and stayed elevated during most of the year, when the market was essentially flat.
The S&P 500 could well test the 1,350 area - a 12 percent drop from current levels - or even see the 1,267 area, which would constitute an 18 percent tumble, she said.
"I still think we have a significant correction in store, well beyond a 2011-style event," Doolittle said.
(Read More: Shorts Getting Longer as Bears Throw In the Towel)
Nicholas Colas, chief market strategist at ConvergEx, said the VIX likely would be higher considering the level of domestic and global tumult - the Boston Marathon bombings, the North Korean nuclear scare, China growth slowing - but is being held down by Federal Reserve money creation and asset buying.
He said investors have two choices: Expect volatility return to the historical norm around 20 "and load up on any instrument which will profit" from the rise; or bet that the Fed's success in inflating stock prices can continue.
"On what planet is a CBOE VIX Index reading of 14 a fair assessment of near term stock market price volatility?" Colas said in a note to clients Wednesday. "A planet where Federal Reserve monetary policy still tightly holds the reins of capital markets, unless you have a better explanation of this clearly anomalous reading."
http://www.cnbc.com/id/100649959
- Mensagens: 35428
- Registado: 5/11/2002 12:21
- Localização: Barlavento
Blue Epsilon Escreveu:VIX fora das BB...
Iremos ter subidas do S&P em breve?
Estou short no VXX (para variar).
Vamos com calma. A vela apresentada e que suporta o comentário de que iremos ter subidas para breve, não é semelhante há que ocorreu por volta de 24 de dezembro, realidade bem visível no gráfico ? É que o VIX continuou a subir, após o surgimento da dita vela em 24/12.

B Negócios
-

- Mensagens: 876
- Registado: 15/1/2009 21:17
- Localização: 16
rsacramento Escreveu:e se te explicasses melhor?
O Dec. Lei é, digamos assim, uma regra empírica que relaciona o fecho do S&P relativamente às Bollinger Bands e o aparecimento de eventuais ressaltos.
O zecatreca pode explicar melhor os parâmetros que eu não me "alembro".
- Mensagens: 35428
- Registado: 5/11/2002 12:21
- Localização: Barlavento
Leomiguel Escreveu:Blue Epsilon Escreveu:VIX fora das BB...
Iremos ter subidas do S&P em breve?
Estou short no VXX (para variar).
Caro Blue Epsilon,
O Vix está bem dentro das BBs...
Tens razão. Na verdade abriu bem fora das BBs, mas voltou para dentro devido à recuperação do S&P.
Vamos ver como fecha.
Segue a tendência e não te armes em herói ao tentar contrariá-la.
Podes tentar, mas o Mercado é um monstro selvagem que provavelmente te irá engolir.
Podes tentar, mas o Mercado é um monstro selvagem que provavelmente te irá engolir.
-

- Mensagens: 1325
- Registado: 29/11/2007 2:13
- Localização: Porto