CALDEIRÃO DE BOLSA
Fórum dedicado à discussão sobre os Mercados Financeiros - Bolsas de Valores
http://teste.caldeiraodebolsa.jornaldenegocios.pt/
ICHIMOKU KINKŌ HYŌ
http://teste.caldeiraodebolsa.jornaldenegocios.pt/viewtopic.php?f=3&t=84649
Página 1 de 1
Re: ICHIMOKU KINKŌ HYŌ
Muito, muito bom. Não lhe dei maior destaque por estar falado em espanhol...
Re: ICHIMOKU KINKŌ HYŌ
Re: ICHIMOKU KINKŌ HYŌ
Caro Tremal, sei que há analistas que fazem análises utilizando apenas o kumo e mms, já vi análises em que eram tidos em consideração o tenkan, o kijun e o rsi14!. De uma forma clara quero dizer que se o japoca que se deu ao trabalho de criar esta ferramenta a fez como a conhecemos, é assim que a devemos utilizar. Vais ver que com o tempo olhas para o Ichimoku e lês as suas informações de uma forma quase intuitiva.
Interiorizamos de tal forma o seu conteúdo que criamos vícios de análise. No meu caso, esqueço-me muitas vezes de dar a devida importância a situações que às vezes podem ter interesse. Isto apesar de conhecer as suas implicações. Como com a condução: criamos vícios, gestos e atitudes repetidas que reconhecemos parciais face ao que deveria ser feito, mas que por (mau) hábito deixamos de perspectivar completamente.
É só nesse sentido que te peço para aceitares as minhas críticas e te peço que me critiques sempre que te aprouver.
Um abraço,
Raposo Tavares
"[...]foram isolados os gráficos do BCP (linha preta) e uma das linhas do Ichimoku: a linha chikou span, marcada a verde." O preço deve ser sempre representado em velas japonesas. Tem importância o cruzamento do chikou sobre o preço. O momento de compra é mais forte se o chikou cruza o preço em movimento fortemente ascendente, enquanto este (o preço) é representado em velas vermelhas em queda acentuada. Um sinal forte de compra dá-se quando o o chikou cruza no sentido norte/sul um conjunto de alegres e aéreas velas verdes.
Atenção à posição destes cruzamentos face ao kumo. Um movimento de compra é mais forte se se verificar acima do kumo, ou se o chikou, a breve prazo, o ultrapassar. Um movimento de venda é mais desesperante se se verificar abaixo do kumo.
Interiorizamos de tal forma o seu conteúdo que criamos vícios de análise. No meu caso, esqueço-me muitas vezes de dar a devida importância a situações que às vezes podem ter interesse. Isto apesar de conhecer as suas implicações. Como com a condução: criamos vícios, gestos e atitudes repetidas que reconhecemos parciais face ao que deveria ser feito, mas que por (mau) hábito deixamos de perspectivar completamente.
É só nesse sentido que te peço para aceitares as minhas críticas e te peço que me critiques sempre que te aprouver.
Um abraço,
Raposo Tavares
TremalNaik Escreveu:O que nos diz a linha chinkou span do Ichimoku sobre o BCP?
No referencial, foram isolados os gráficos do BCP (linha preta) e uma das linhas do Ichimoku: a linha chinkou span, marcada a verde. A linha chinkou span é igual à linha preta, ou seja, é realmente a mesma linha, mas está atrasada em relação à linha preta (gráfico do BCP) 26 sessões. Assim, se fizermos uma translação para “Este” da chinkou span, com o comprimento de 26 sessões, as linhas verde e preta, naturalmente, coincidem.
Isto quer dizer que todas as observações feitas sobre a chinkou span estão atrasadas 26 sessões em relação ao dia em que o observador fez o registo.
Segundo o Ichimoku, se a chinkou span cruzar o gráfico para baixo é dado um sinal de venda; se a chinkou span cruzar o gráfico para cima é dado um sinal de compra.
A primeira ilustração mostra um sinal de venda. Repare-se na posição do observador: 26 sessões à frente do cruzamento das linhas. Nesse dia, o BCP cotava a 20 cêntimos. É muito claro no gráfico que nas sessões seguintes, e ao longo de um mês, o BCP cai para menos de 14 cêntimos.
A segunda ilustração mostra o sinal de compra que ainda se mantém vigente. A chinkou span cruza o gráfico para cima no dia 7 de Fevereiro. Claro que o observador está 26 sessões adiantado, no dia 20 de Março. O BCP cota nesse dia a 16,3 cêntimos e, como sabemos o resto da história, vai subir 50% até aos 24 cêntimos do dia de hoje.
Há indícios, já apontados pelo Raposo Tavares, de que se pode estar a aproximar um ponto de venda. É que a chinkou span (linha verde) está quase a tocar na linha escura do gráfico, como é bem visível na terceira ilustração. A próxima semana ainda não é de grande risco, porque o gráfico (olhe-se para o fim da linha verde) vai fazer um vale. Pode até descer aos 22,5 cêntimos que os alarmes não disparam. Mas, a curto prazo, à distância de 10 sessões, ou o BCP passa a linha dos 24,5 cêntimos ou o chinkou span vai dar inevitavelmente sinal de venda.
Tenho a noção exacta de que esta análise, para quem conhece o Ichimoku, é muito básica. Partilho-a para travar o ímpeto entusiasta que me levou a escrever num post anterior, sobre o BCP, “Que belo Ichimoku”. E também porque achei engenhosa esta ideia de estudar uma linha que leva um atraso de 26 sessões sobre a realidade. Num contexto diferente, de admiração artística da análise técnica, apetece dizer, agora, que belo é o Ichimoku.
Bom fs
TN
"[...]foram isolados os gráficos do BCP (linha preta) e uma das linhas do Ichimoku: a linha chikou span, marcada a verde." O preço deve ser sempre representado em velas japonesas. Tem importância o cruzamento do chikou sobre o preço. O momento de compra é mais forte se o chikou cruza o preço em movimento fortemente ascendente, enquanto este (o preço) é representado em velas vermelhas em queda acentuada. Um sinal forte de compra dá-se quando o o chikou cruza no sentido norte/sul um conjunto de alegres e aéreas velas verdes.
Atenção à posição destes cruzamentos face ao kumo. Um movimento de compra é mais forte se se verificar acima do kumo, ou se o chikou, a breve prazo, o ultrapassar. Um movimento de venda é mais desesperante se se verificar abaixo do kumo.
Re: ICHIMOKU KINKŌ HYŌ
A propósito de uma conversa com o Tremal:
viewtopic.php?f=3&t=19774&hilit=ichimoku
viewtopic.php?f=3&t=62642&hilit=ichimoku
Pronto,
um abraço,
Raposo Tavares
viewtopic.php?f=3&t=19774&hilit=ichimoku
viewtopic.php?f=3&t=62642&hilit=ichimoku
Pronto,
um abraço,
Raposo Tavares
Re: ICHIMOKU KINKŌ HYŌ
NM_2 Escreveu:Boa analise já aprendi umas coisas!!!!!
Obrigado pelas palavras, NM.
Vamos esperar que sirvam para alguma coisa de jeito...
Pessoalmente, do pouco que sei, estou a gostar da 'ferramenta. E tem uma vantagem grande: não há muitos discípulos a complicar uma boa ideia.
Um abraço,
Raposo Tavares
Re: ICHIMOKU KINKŌ HYŌ
O espírito das forquilhas não tem nada a ver com a onda mais zen do Ichimoku. Daí ter-me lembrado da corrida do burro e do Ferrari. Ao rigor das linhas retas do Andrews, o Ichimoku gosta de núvens, de golpes de olho, de passeios pelas colinas... Enfim! coisas de japocas. Recordo, a este propósito, o que se diz aqui, https://www.ichimokutrade.com/articles/ ... _Ebook.pdf , na página17:
Desculpem-me pois a recreação. Daqui por uns tempos veremos as diferenças de análise que estes dois 'sistemas/utensílios' podem suscitar.
Um abraço,
Raposo Tavares
Ichimoku Kinko Hyo and Trend Trading
It must be understood by any who wishes to use the power of Ichimoku Kinko Hyo that it is, first and foremost, a
trend trading system. It is further assumed that the trader wielding Ichimoku does so with a solid undertanding of the
basic tenets of trend trading. This is a key assumption, since knowledge of how to trade the trend is absolutely critical
to long-term success with Ichimoku. Ichimoku on its own will not teach one the underlying philosophy of trend
following, so we must make a special mental note at this point regarding the key factors involved in successful trend
trading.
Trend traders:
o NEVER attempt to predict where the market will go
o NEVER attempt to pick "tops" and "bottoms" of price action
o ALWAYS respect the trend and align their trades accordingly
o Let the market tell them when the trend is finished, not their "intuition"
o Realize that they will necessarily sacrifice some pips at the beginning and end of a trend as
they wait for confirmation that the trend beginning and end are authentic
o Look at price action from a long-term perspective and don't get shaken by volatility
o Understand that they will go through some potentially significant but temporary periods of
drawdown as the trend matures
o Understand that trend trading can lead to large gains but also equally large losses
o Understand that trends can take place on multiple time frames
Profitable trend trading is 99% mental. If one can conquer their mind and quell the inevitable inner dialogue that
screams "Whoa! Looks like price is going against your position! The trend must be ending - SELL NOW!!" and keep
their eyes on the long term, they stand an excellent chance at being a successful, happy and stress-free trend trader.
However, if they cannot turn off this inner dialogue or at least ignore it and keep their focus on the long-term, then
they are in for a very short, very bumpy ride as a Forex trader.
Desculpem-me pois a recreação. Daqui por uns tempos veremos as diferenças de análise que estes dois 'sistemas/utensílios' podem suscitar.
Um abraço,
Raposo Tavares
Re: ICHIMOKU KINKŌ HYŌ
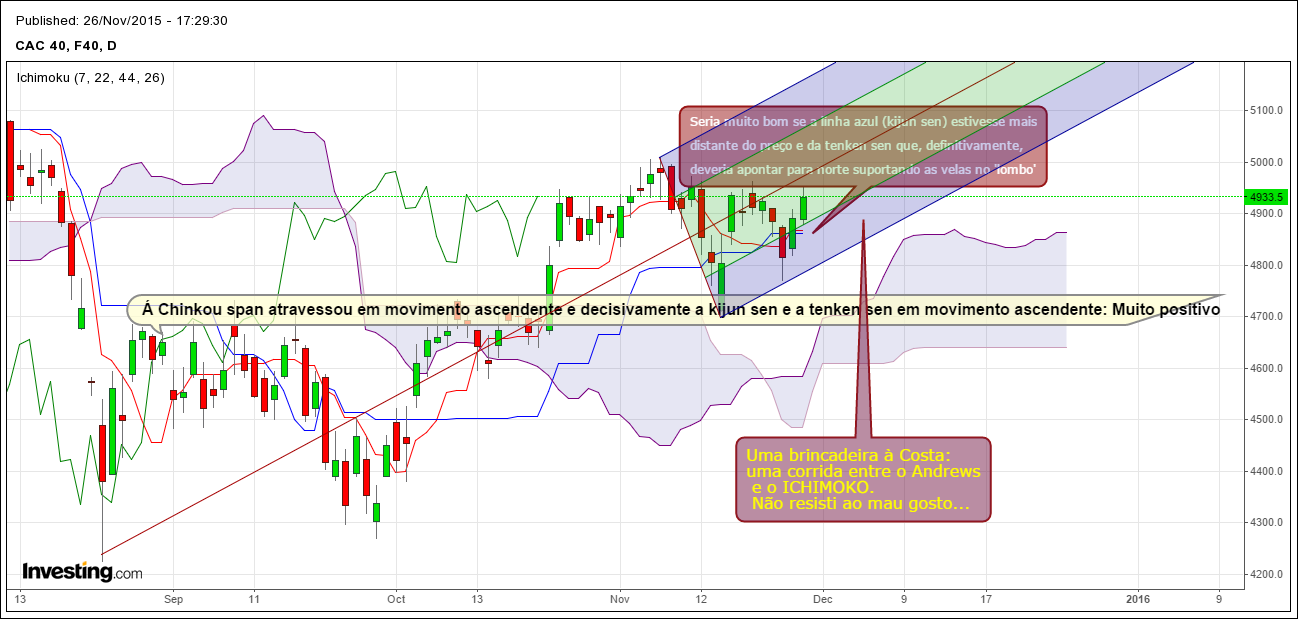
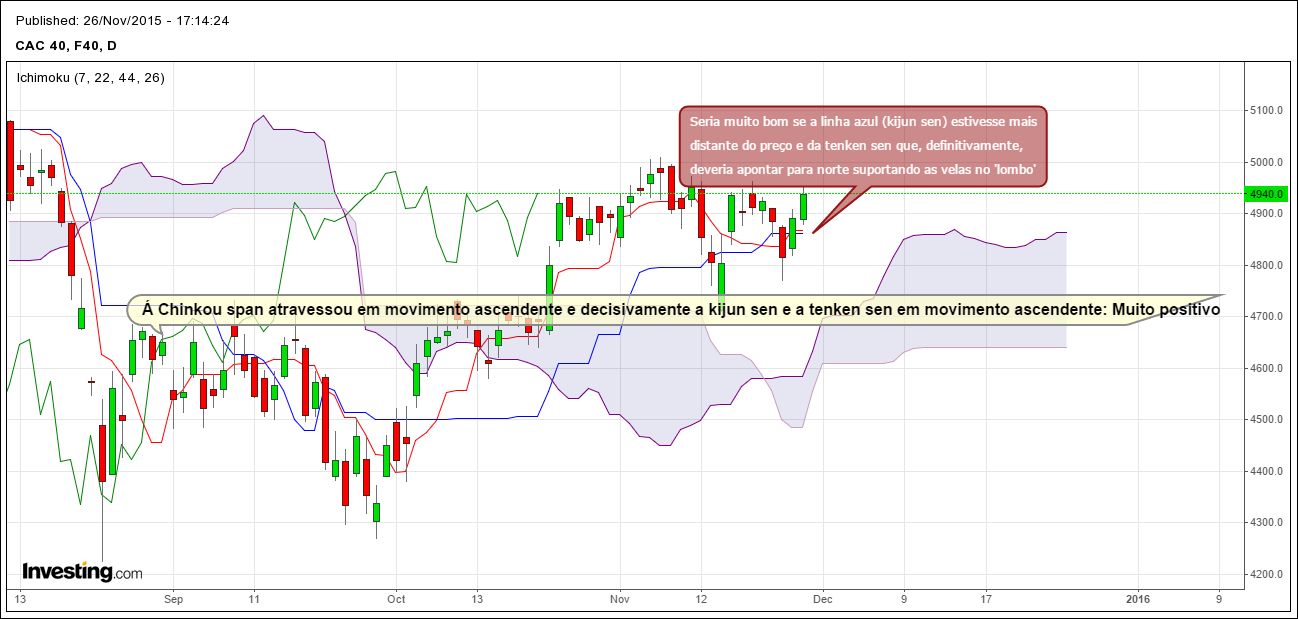
O CAC num diário de prazo curto (de agosto até agora).
Re: ICHIMOKU KINKŌ HYŌ
Apesar de não estar investido no S&P, confesso que a vivacidade deste índice exerce sobre mim algum fascínio. Assim, deixei há pouco uns bonecos no tópico do S&P que não justifiquei devidamente.
Para além de pretender chamar a atenção para a similitude de duas situações neste índice. Uma entre 2011 e 2012 e a outra no momento atual.
Pretendia ainda por em evidencia alguns pormenores técnicos que ilustro depois do boneco abaixo.
O Semanal do S&P por estes dias:
O que diz a Bíblia:
Kumo Breakout
A strong kijun sen cross Buy signal takes place when a bullish cross happens above the kumo. (pag. 21)
Kumo Breakout trading or "Kumo Trading" is a trading strategy that can be used on multiple time frames, though it is
most widely used on the higher time frames (e.g.: Daily, Weekly, Monthly) of the position trader. Kumo breakout
trading is the purest form of trend trading offered by the Ichimoku charting system, as it looks solely to the kumo and
price's relationship to it for its signals. It is "big picture" trading that focuses only on whether price is trading above or
below the prevailing kumo. In a nutshell, the signal to go long in Kumo breakout trading is when price closes above
the prevailing kumo and, likewise, the signal to go short is when price closes below the prevailing kumo. (Pag. 25)
A Bíblia: https://www.ichimokutrade.com/articles/ ... _Ebook.pdf
Um abraço,
Raposo Tavares
Re: ICHIMOKU KINKŌ HYŌ
Boa analise já aprendi umas coisas!!!!!
Re: ICHIMOKU KINKŌ HYŌ
O S&P no gráfico diário:
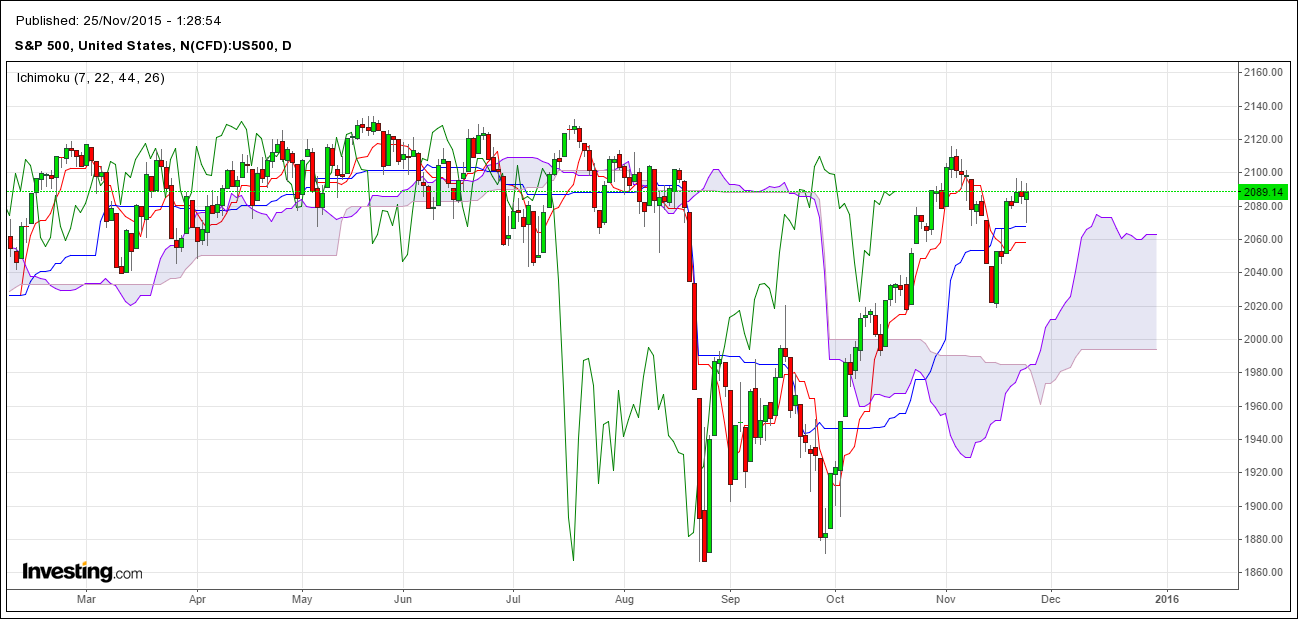
No diário parece claro que se está a criar uma nuvem de suporte ao ìndice que a custo procura regressar aos máximos de há alguns meses atrás. Neste sentido, apesar do aspeto promissor da linha verde (chinkou span) que se mantém firme acima dos valores do S&P desde que o superou de baixo para cima quando estes, no final de agosto, terminavam o seu movimento de quebra. Positivo também o facto de o vermelho teken sen começa a dar sinais de querer apontar para norte. O ideal seria que neste movimento confirmasse a sua disposição altista de curto prazo, ultrapassando o azul Kijun sen que, de momento, assume uma atitude positiva e faz o seu papel resguardando uma distância higiénica face ao 'preço', mantendo-se abaixo dele.
No semanal:
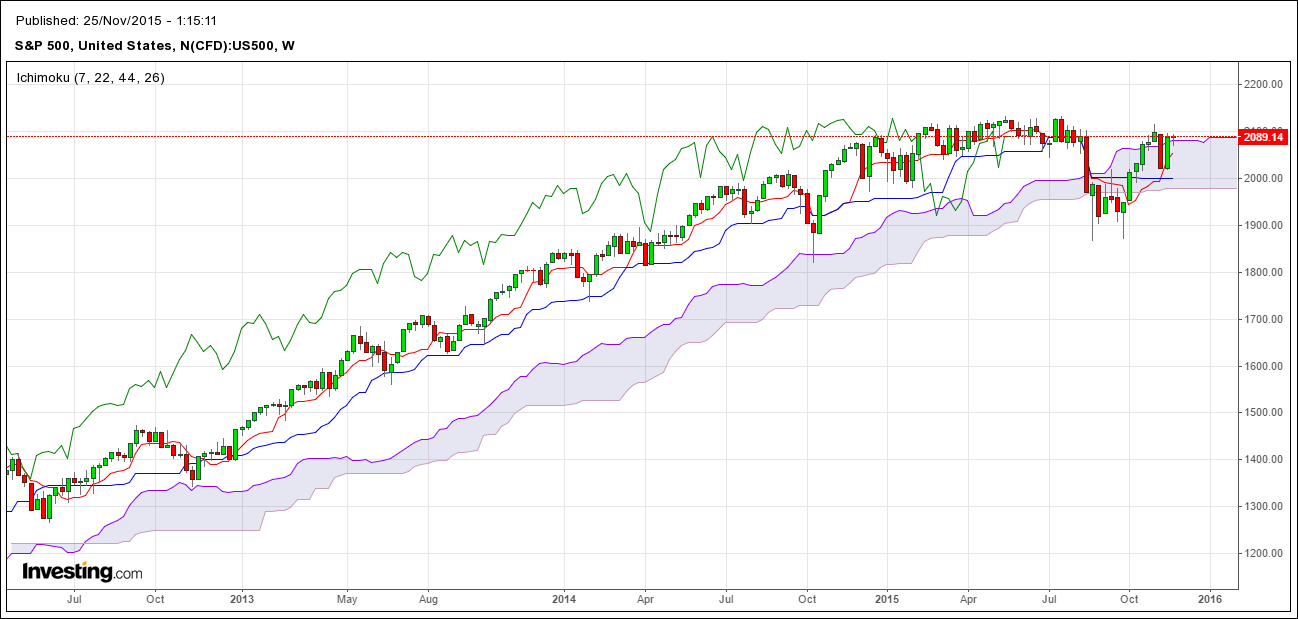
Num gráfico semanal as coisas tornam-se mais repousantes. Pessoalmente prefiro assim...
Assim, o Chinkou span atravessa resolutamente o valor do índice na direção correta recuperando o movimento bullish que já ostenta desde 2009.
O azul Kijun sen apresenta-se convenientemente estável abaixo do índice. Esta situação, a manter-se será bastante positiva para a evolução do valor do índice em análise.
Também o vermelhusco Teken sen se apresenta bullish e aponta claramente para norte.
Procurando dar espessura a estas promessas a nuvem ascende e engrossa parecendo disposta a satisfazer os desejos de quem quer ver o S&P bater os seus máximos de sempre.
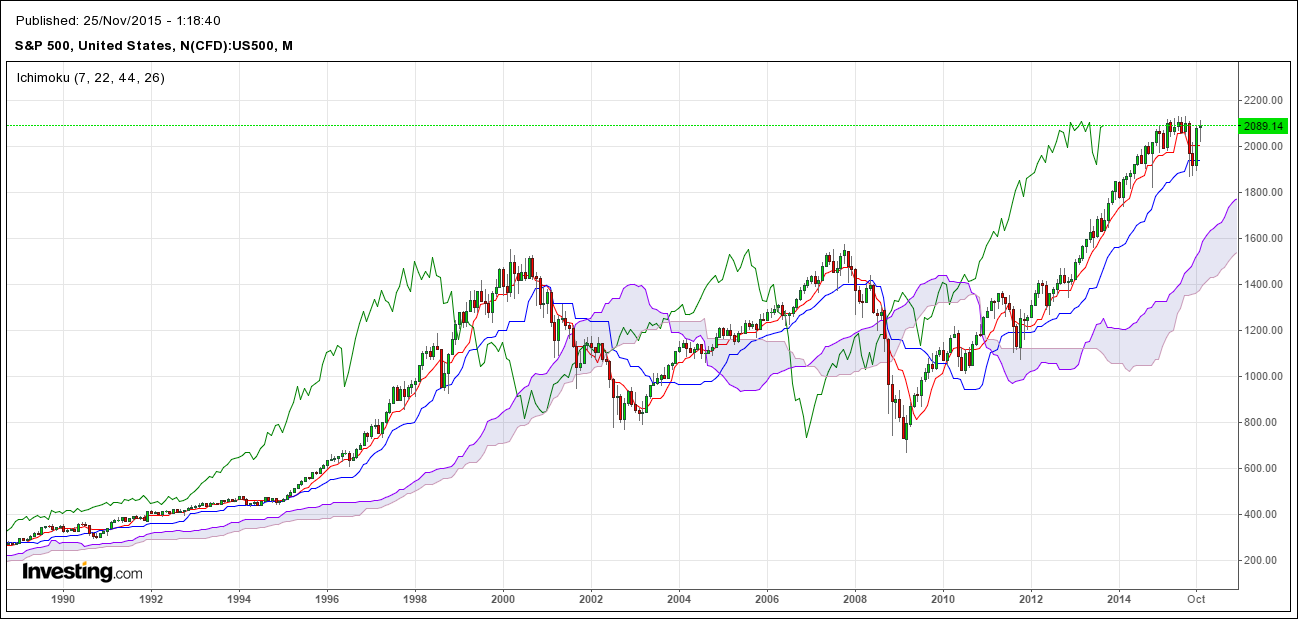
No mensal parece que todas as observações anteriores se potenciam:
No diário parece claro que se está a criar uma nuvem de suporte ao ìndice que a custo procura regressar aos máximos de há alguns meses atrás. Neste sentido, apesar do aspeto promissor da linha verde (chinkou span) que se mantém firme acima dos valores do S&P desde que o superou de baixo para cima quando estes, no final de agosto, terminavam o seu movimento de quebra. Positivo também o facto de o vermelho teken sen começa a dar sinais de querer apontar para norte. O ideal seria que neste movimento confirmasse a sua disposição altista de curto prazo, ultrapassando o azul Kijun sen que, de momento, assume uma atitude positiva e faz o seu papel resguardando uma distância higiénica face ao 'preço', mantendo-se abaixo dele.
No semanal:
Num gráfico semanal as coisas tornam-se mais repousantes. Pessoalmente prefiro assim...
Assim, o Chinkou span atravessa resolutamente o valor do índice na direção correta recuperando o movimento bullish que já ostenta desde 2009.
O azul Kijun sen apresenta-se convenientemente estável abaixo do índice. Esta situação, a manter-se será bastante positiva para a evolução do valor do índice em análise.
Também o vermelhusco Teken sen se apresenta bullish e aponta claramente para norte.
Procurando dar espessura a estas promessas a nuvem ascende e engrossa parecendo disposta a satisfazer os desejos de quem quer ver o S&P bater os seus máximos de sempre.
No mensal parece que todas as observações anteriores se potenciam:
Re: ICHIMOKU KINKŌ HYŌ
Raposo Tavares Escreveu:No final do dia de hoje ou no final do dia de amanhã apresento uma interpretação deste boneco com os dados atualizados:
Força estou curioso....
Re: ICHIMOKU KINKŌ HYŌ
No final do dia de hoje ou no final do dia de amanhã apresento uma interpretação deste boneco com os dados atualizados:

Re: ICHIMOKU KINKŌ HYŌ
Amigo DC 89
Obrigado pelas tuas palavras.
A análise possível no estádio atual da ciência é o seguinte:

A propósito dos flats e dos bottons kumos:
Aqui, lá pela página 16 https://www.ichimokutrade.com/articles/ ... _Ebook.pdf
Obrigado pelas tuas palavras.
A análise possível no estádio atual da ciência é o seguinte:
A propósito dos flats e dos bottons kumos:
Flat Top/Bottom Kumos
The flat top or bottom that is often observed in the kumo is key to understanding one piece of the kumo's "equilibrium
equation". Just like the "rubber band effect" that a flat kijun sen can exert on price, a flat Senkou span B can act in the
same way, attracting price that is in close proximity. The reason for this is simple: a flat Senkou span B represents the
midpoint of a trendless price situation over the prior 52 periods - price equilibrium. Since price always seeks to return
to equilibrium, and the flat Senkou span B is such a strong expression of this equilibrium, it becomes an equally strong
attractor of price.
In a bullish trend, this flat Senkou span B will result in a flat bottom kumo and in a bearish trend it will manifest as a
flat top kumo. The Ichimoku practitioner can use this knowledge of the physics of the flat Senkou span B in order to
be more cautious about both their exits out of the kumo. For instance, when exiting a flat bottom (bullish) kumo from
the bottom, rather than merely placing an entry order 10 pips below the Senkou span B, savvy Ichimoku practitioners
will look for another point around which to build their entry order to ensure they don't get caught in the flat bottom's
"gravitational pull". This method minimizes the number of false breakouts experienced by the trader.
Aqui, lá pela página 16 https://www.ichimokutrade.com/articles/ ... _Ebook.pdf
Re: ICHIMOKU KINKŌ HYŌ
Boa iniciativa Raposo, vou acompanhar!
Pessoalmente já utilizei e não me satisfez mas a verdade é que também não insisti muito dado nessa altura ter optado por focar-me em desenvolver mais a parte de disciplina, risk management etc, do que "especializar-me" em qualquer indicador especifico.
Pessoalmente já utilizei e não me satisfez mas a verdade é que também não insisti muito dado nessa altura ter optado por focar-me em desenvolver mais a parte de disciplina, risk management etc, do que "especializar-me" em qualquer indicador especifico.
Re: ICHIMOKU KINKŌ HYŌ
Da próxima vez que voltar ao tópico será para analisar o boneco aí de baixo:

Re: ICHIMOKU KINKŌ HYŌ

Começar isto com uma ação do Euronext parisiense que sigo e onde procuro um sinal de compra. Esse sinal, como fica evidente, não aparece neste boneco. Interessante que num gráfico de velas no mesmo espaço temporal há um suporte mais ou menos onde a ação se encontra agora.
Como aconselha o universitário espanhol aí dos videos, alterei os períodos de 9 para 7 e de26 para 22. No gráfico abaixo não procedi a essa alteração.

Diferenças? A mim parece-me que a linha azul, o Kijun sen foi a que sofreu uma maior alteração. Apesar desta definição:
Kijun-sen
Calcul de Kijun-Sen : (plus haut + plus bas)/2 sur les 26 dernières périodes
C'est une ligne de confirmation et une ligne de support/résistance, qui peut être utilisée
comme un trailing stop. Kijun Sen agit comme un indicateur du futur mouvement du
prix. Si le prix est plus haut que la courbe bleue, il pourrait continuer à grimper plus
haut. Si le prix est en-dessous la courbe bleue, il pourrait continuer à baisser.
A Kijun sen também nos dá a ideia de uma possível 'acalmia no preço' se estiver 'flat'. Quer dizer, é a linha que (é nestas alturas que os caloiros dizem disparates...) mais espelha a sua vontade, a sua velocidade... (Editei: na 'Bíblia, atribuem-lhe a possibilidade de nos mostrar o equilibrio da cotação. Portanto: equilibrio. Assim é que é!in: https://www.ichimokutrade.com/articles/ ... _Ebook.pdf )
Re: ICHIMOKU KINKŌ HYŌ
Podias ter era continuado o único tópico existente sobre o Ichimoku que já existia. Não era preciso estar a abrir um tópico novo.
Re: ICHIMOKU KINKŌ HYŌ
Abri o tópico e pus-me a pensar como é que o haveria de desenvolver. Pareceu-me que a forma mais lógica e pedagógica de lhe dar continuidade e de lhe assegurar alguma utilidade será o 'aprender fazendo'. Como não tenho a pretensão de dar lições a ninguém, proponho-me analisar (que é como quem diz...) dois ou três títulos por semana e o mais sucintamente possível tentar explicar as razões que suportam determinada análise à luz deste método.
Obviamente que toda a gente poderá participar neste tópico.
Quanto a pedidos de explicações... tomara eu nestes primeiros tempos tê-las para mim, quanto mais...
E pronto.
Obviamente que toda a gente poderá participar neste tópico.
Quanto a pedidos de explicações... tomara eu nestes primeiros tempos tê-las para mim, quanto mais...
E pronto.
ICHIMOKU KINKŌ HYŌ
Vou ler umas coisas sobre o ICHIMOKU KINKŌ HYŌ. Há por ali umas ideias que me parecem interessantes.
Para já, alguma web e bibliografia:
En português:
http://asnuvensdoichimoku.blogspot.pt/p ... ou-eu.html
[Um muito bom blogue na nossa língua]
Em francês:
http://echosforex.fr/upload/ichimokuwinners.pdf
Uma tradução do inglês muito aceitável. Sem dúvida uma ótima ferrramenta de aprendizagem para todos os interessados
Em inglês:
https://www.ichimokutrade.com/articles/ ... _Ebook.pdf
A Bíblia da coisa
En espanhol:
Pronto. Por agora vou ser humildezinho, mas não tarda nada não partilho peva e mando-vos estudar. Pois. Cambada de preguiçosos... E não partilho nada.